
Setup
Install the Runbook extension
Runbook is available as a Google Sheets add-on. Install it from the Google Workspace Marketplace here:

Launch Runbook
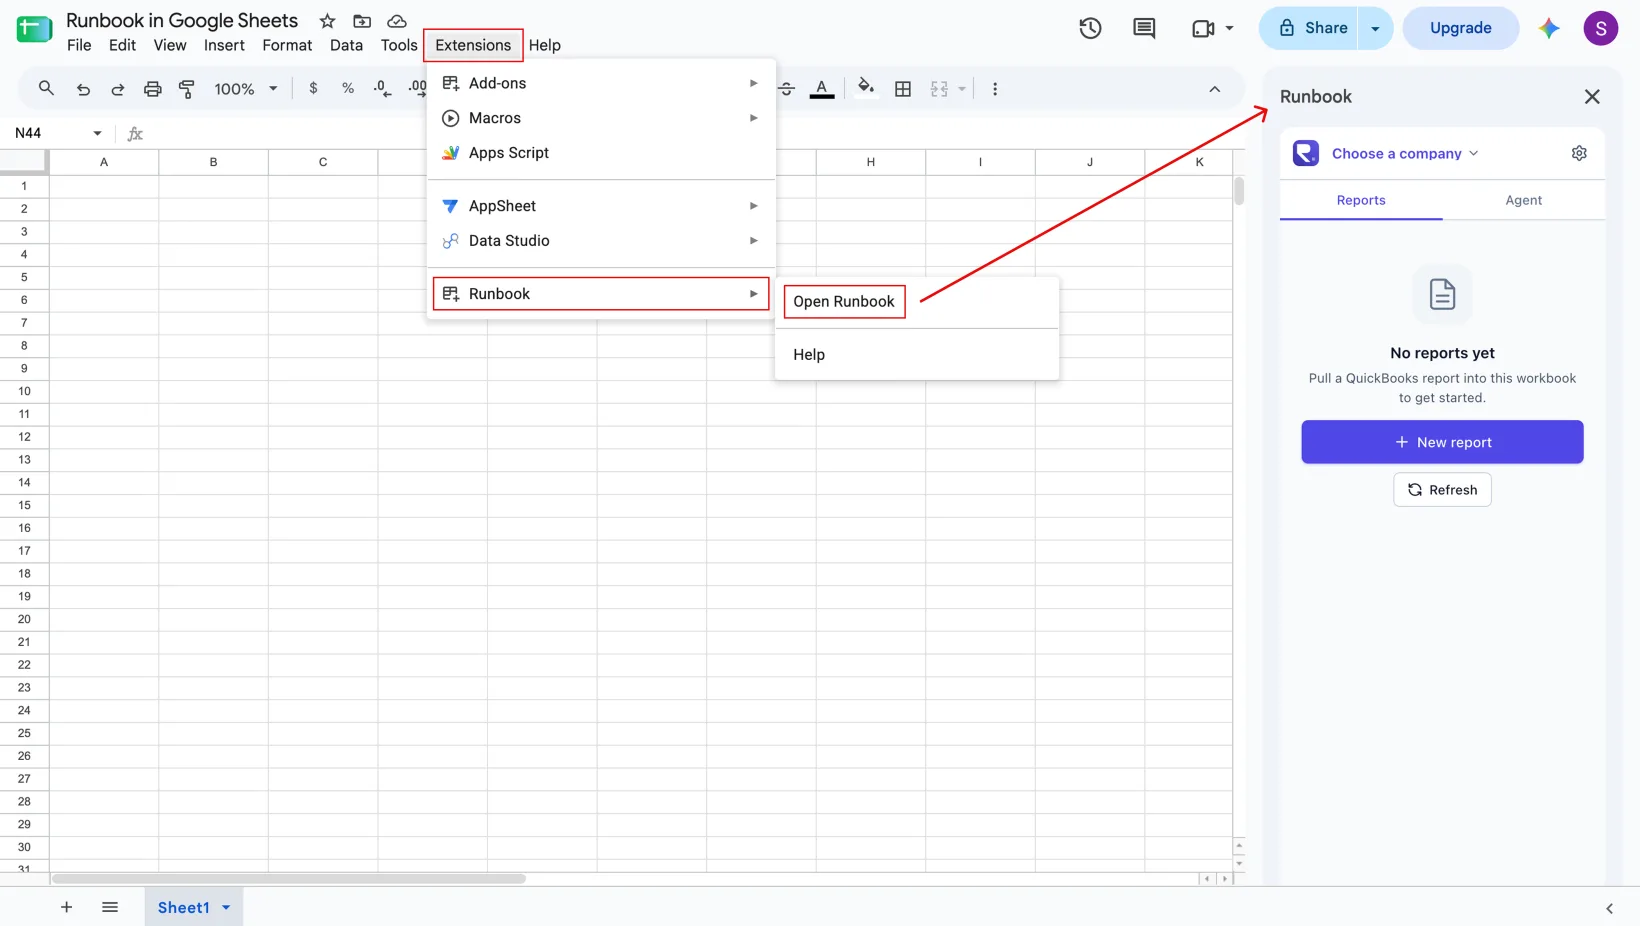
Once installed, open any Google Sheet and navigate to Extensions → Runbook → Open Runbook. This will open the Runbook panel on the right side of your spreadsheet.
Connect QuickBooks
Click the Connect QuickBooks button in Runbook. You'll be redirected to QuickBooks Online to authorize the connection. To connect additional QuickBooks companies, go to Settings → Connect QuickBooks.
Creating reports
In the Reports tab, click New Report at the bottom. This opens the report builder.
Select a company
Before you create a new report, make sure to select a company at the top of the Runbook sidebar.
Select a report type
Runbook supports 30+ QuickBooks reports, including all major reports (Profit and Loss, Balance Sheet, General Ledger, AR/AP Aging, etc.), plus more specialized reports like Budget vs. Actuals and Estimates vs. Actuals.
Select a date range
There are 3 types of report date ranges:
- Dynamic: Choose from dates like "Today" or "This month." Whenever the report is refreshed, the date range will update dynamically. For example, a report with date "This month" will always show the current month of data.
- Static: Select specific start and end dates. You can edit these dates for an existing report later.
- Compare: Select two periods to compare. These can be months, quarters, or years. Runbook will automatically add dollar and percentage variance columns to these reports.
Configure your report
- Choose between Accrual and Cash accounting methods
- Choose how you want to display columns in your report (Total, Month, Customer, etc.)
- Add filters for Class, Location, Customer, etc.
- Choose how you want numbers to be formatted
Using Runbook's AI agent
For a detailed guide on how to use Runbook's agent, along with helpful examples, click here.
In the previous section, we saw how to create standard reports with a defined shape. Runbook's AI agent is great for when you need custom reports or analyses that don't correspond to a pre-defined QuickBooks report. You can start a new agent conversation in the Agent tab.
The agent can read QuickBooks data, pull data into Google Sheets, and build formula-driven reports and analyses directly in your spreadsheet. Just describe the report or analysis you want to see, and the agent will build it for you.
Here are some examples of what you can ask Runbook to build:
- A P&L summary comparing the last two months, with written commentary explaining the largest month-over-month variances
- A cash dashboard showing open balances by account, pending receipts and disbursements, and the change from the prior week
- A P&L budget for next year, based on trends over the last 3 years of data, with editable growth assumptions
- A month-end GL review flagging duplicates, missing vendors, and potential misclassifications
You can then iterate on the output by either giving the agent follow-up instructions or editing it directly in Google Sheets.
Explaining variances with AI commentary
There are two ways to explain period-over-period variances with Runbook.
Explaining individual variances
After you create a Runbook report, you can explain the variance between any two cells by selecting both cells and clicking Explain under that report in the Reports tab.
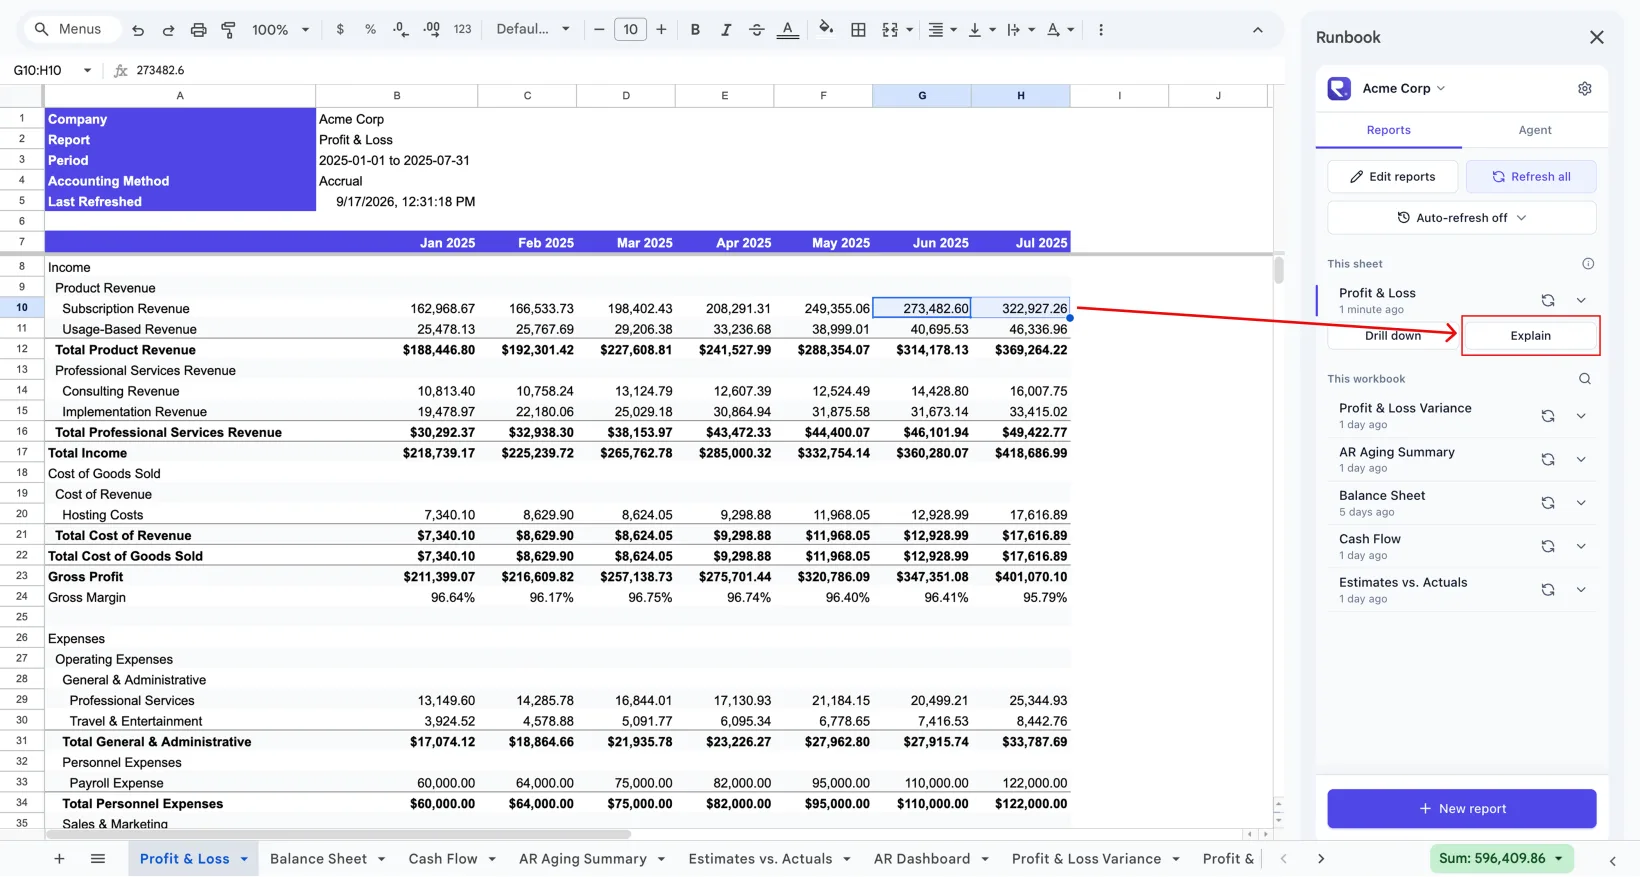
This will add a commentary column to the report with an explanation of what's causing that variance, along with a new deep-dive tab showing the transaction-level detail of the analysis.
Explaining all variances at once
When creating a new Profit & Loss, Balance Sheet, or Cash Flow Statement report, select the Compare date range. This lets you compare two different periods, and the report will automatically calculate the $ and % variance between them.
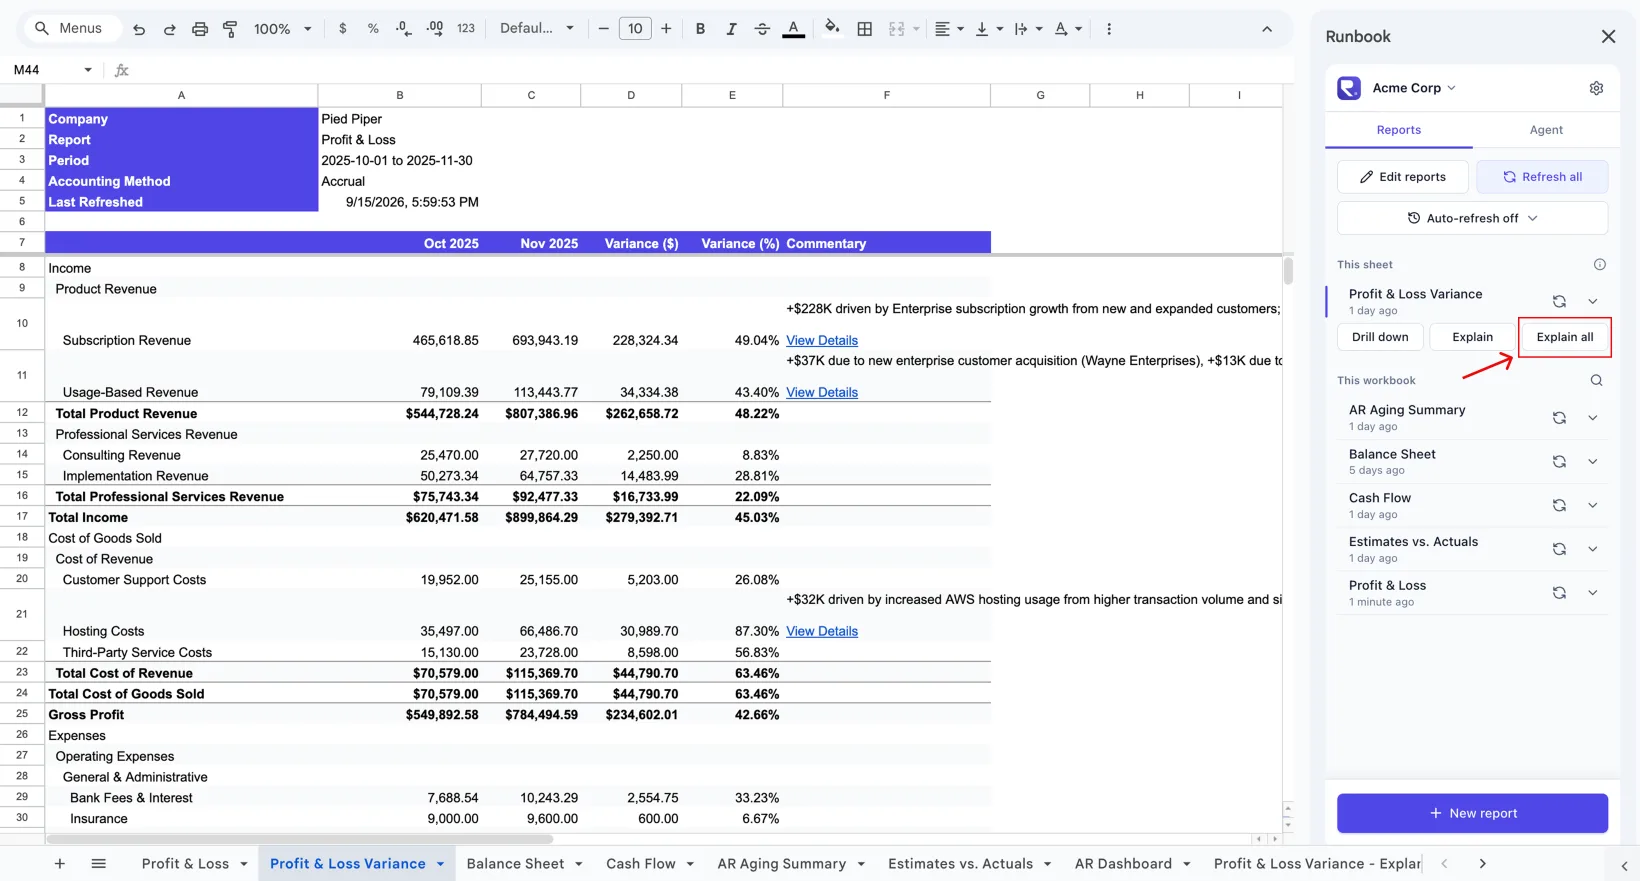
You can then explain what's causing every material variance in that report by clicking Explain all under that report (this is only available in Compare reports). You can then enter a materiality threshold ($ and/or %), and Runbook will explain every variance exceeding that threshold.
Creating drill-down reports
After creating a Runbook report, select one or more cells in an account row and click Drill down under that report.
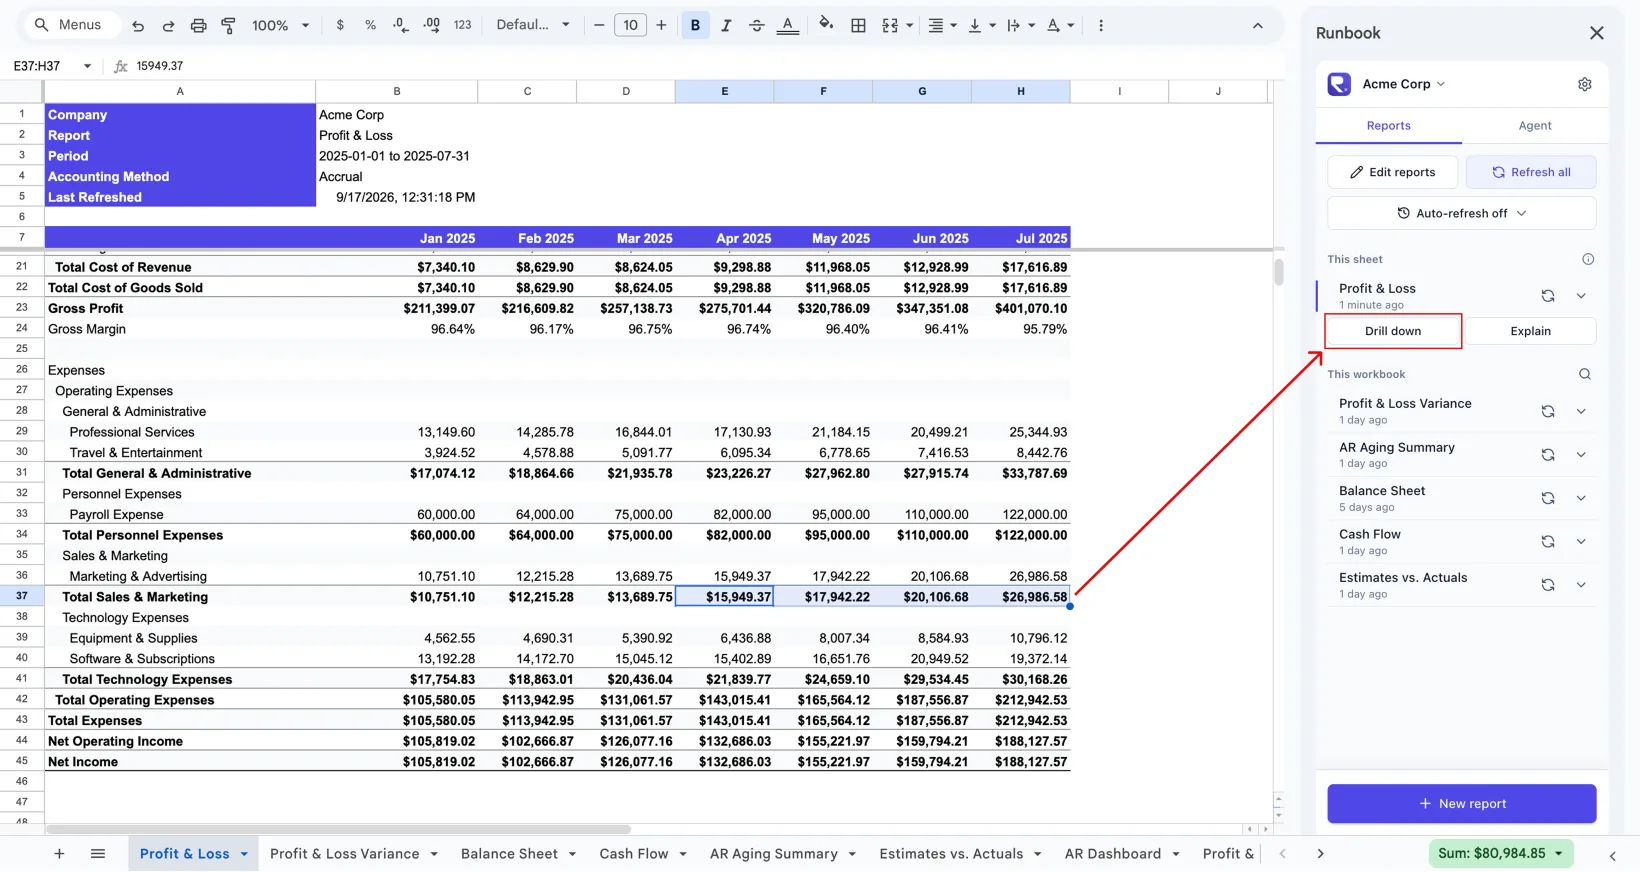
This creates a new tab in your Google Sheet with all of the transactions that make up the selected values, plus a pivot table built on top of those transactions.
You can edit the pivot table to drill down on any dimension. For example, if you want to show software expenses by vendor, you can drill down into the "Software Expense" account on your P&L and edit the pivot table to show expenses by vendor.
Refreshing reports
In the Reports tab, you can view and manage all the reports in your Google Sheet workbook. This includes standard, variance, and drill-down reports.
Refresh an individual report
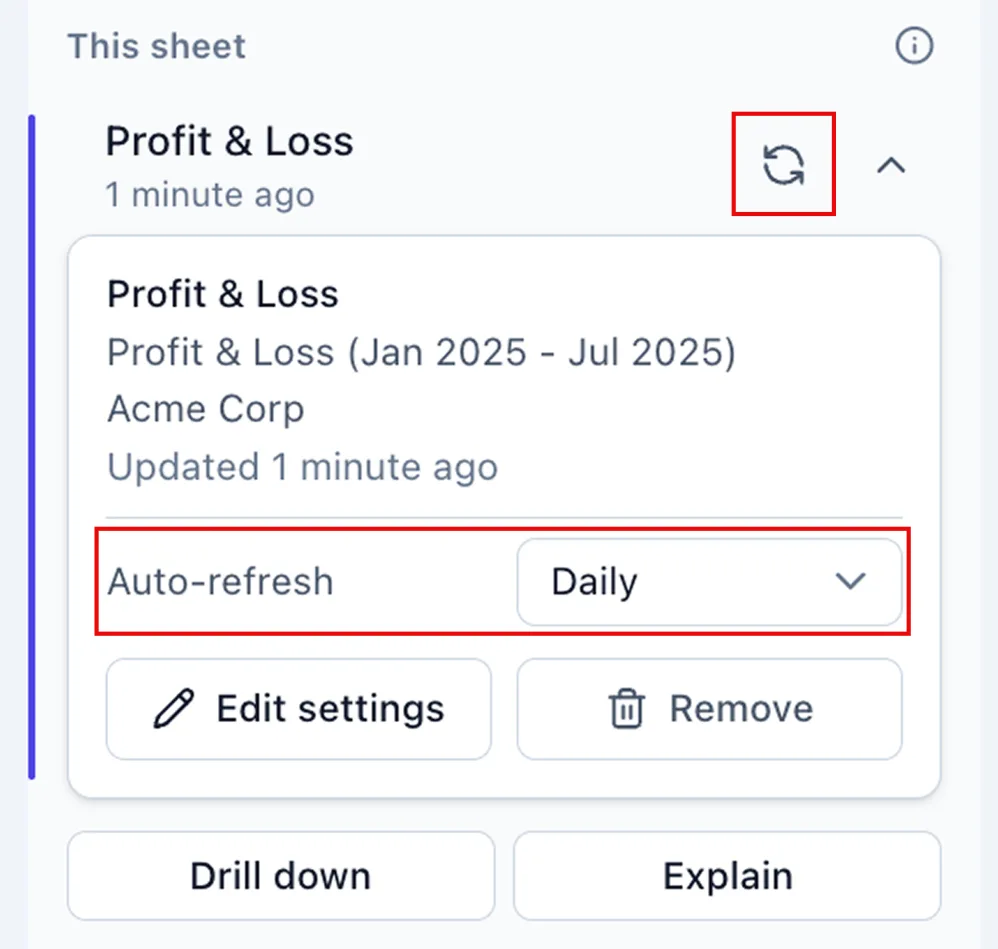
- Manual refresh: Click the refresh icon on a report to update it with the latest QuickBooks data.
- Auto-refresh: Set the report to auto-refresh daily or hourly.
Refresh all reports at once
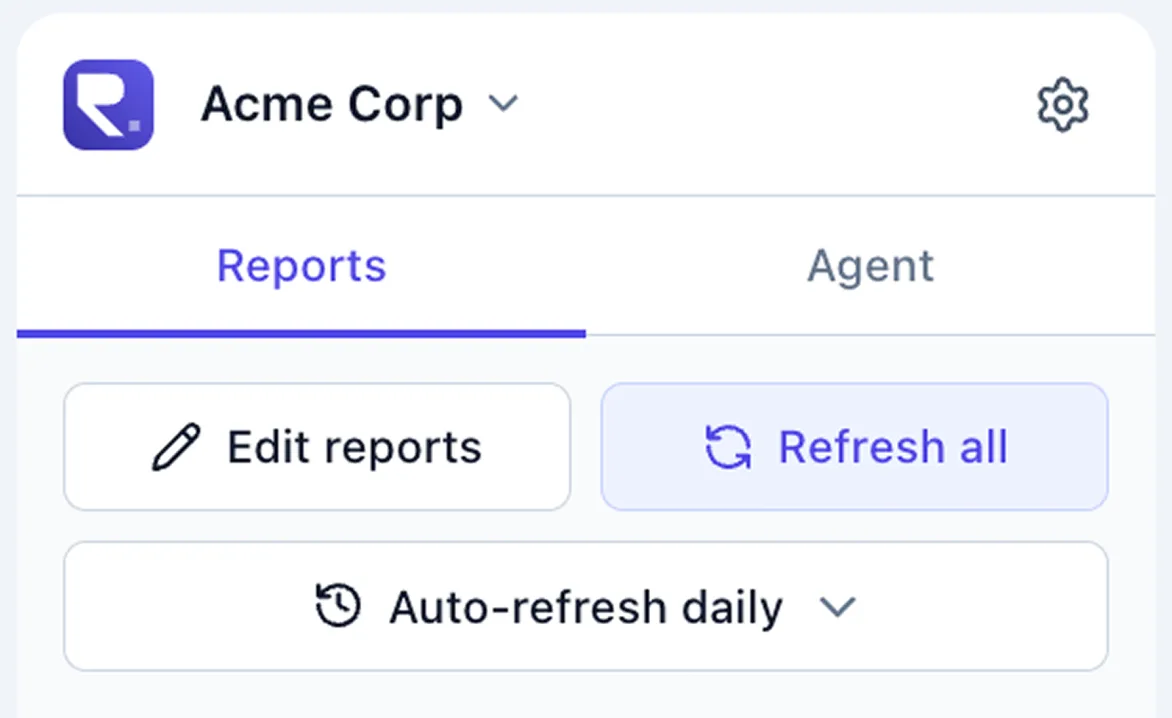
- Manual refresh: Click Refresh all at the top of the Reports tab.
- Auto-refresh: Set all reports to auto-refresh daily or hourly.
Editing reports
You can edit an individual report by clicking Edit settings under that report, or edit all reports at once by clicking Edit reports at the top of the Reports tab.
You can edit the following:
- QuickBooks company (i.e., the source data for the report)
- Date range
- Report filters
- Visual formatting (color, money formatting, row groupings, etc.)
For example, if you have a P&L with date range January - July and you want to add August, you can change the end date to August.
Note: Refreshing or editing a custom report won't overwrite your formatting or break your formulas. Any rows, calculations, or notes you've added alongside the report will be preserved.
Copying reports across clients
If you're an accounting firm managing reports for multiple clients, you can easily copy Runbook reports across all your clients.
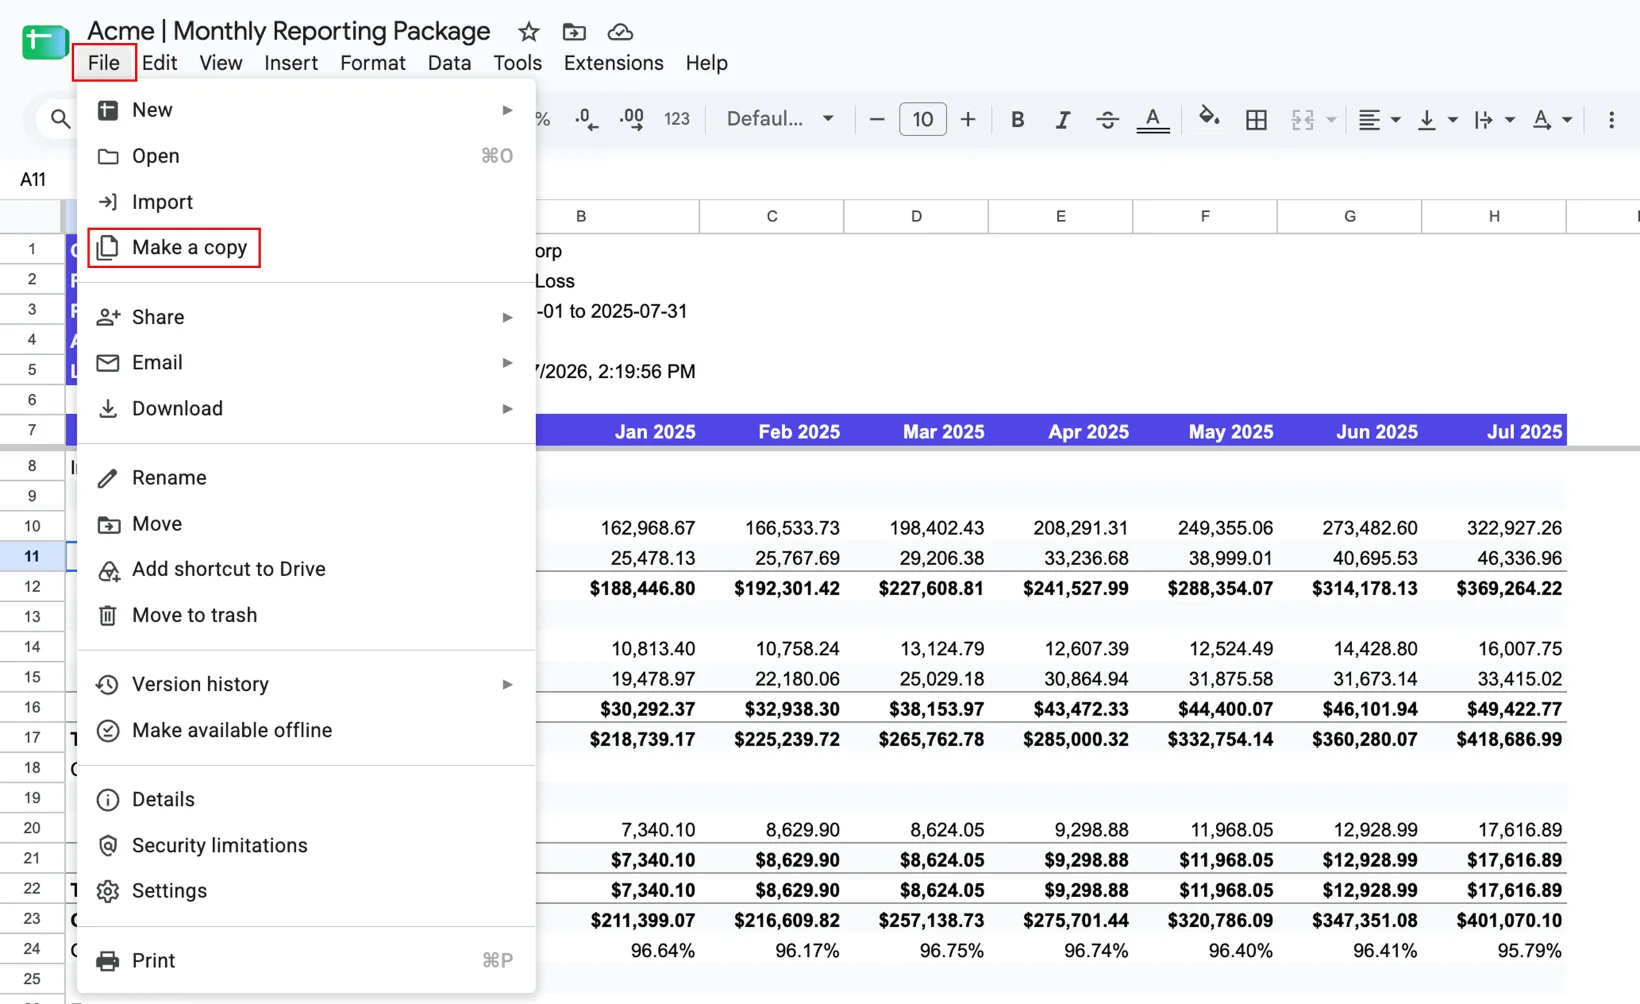
Start by building out a reporting package for one client in a Google Sheets workbook, then create a copy of that workbook by going to File → Make a copy.
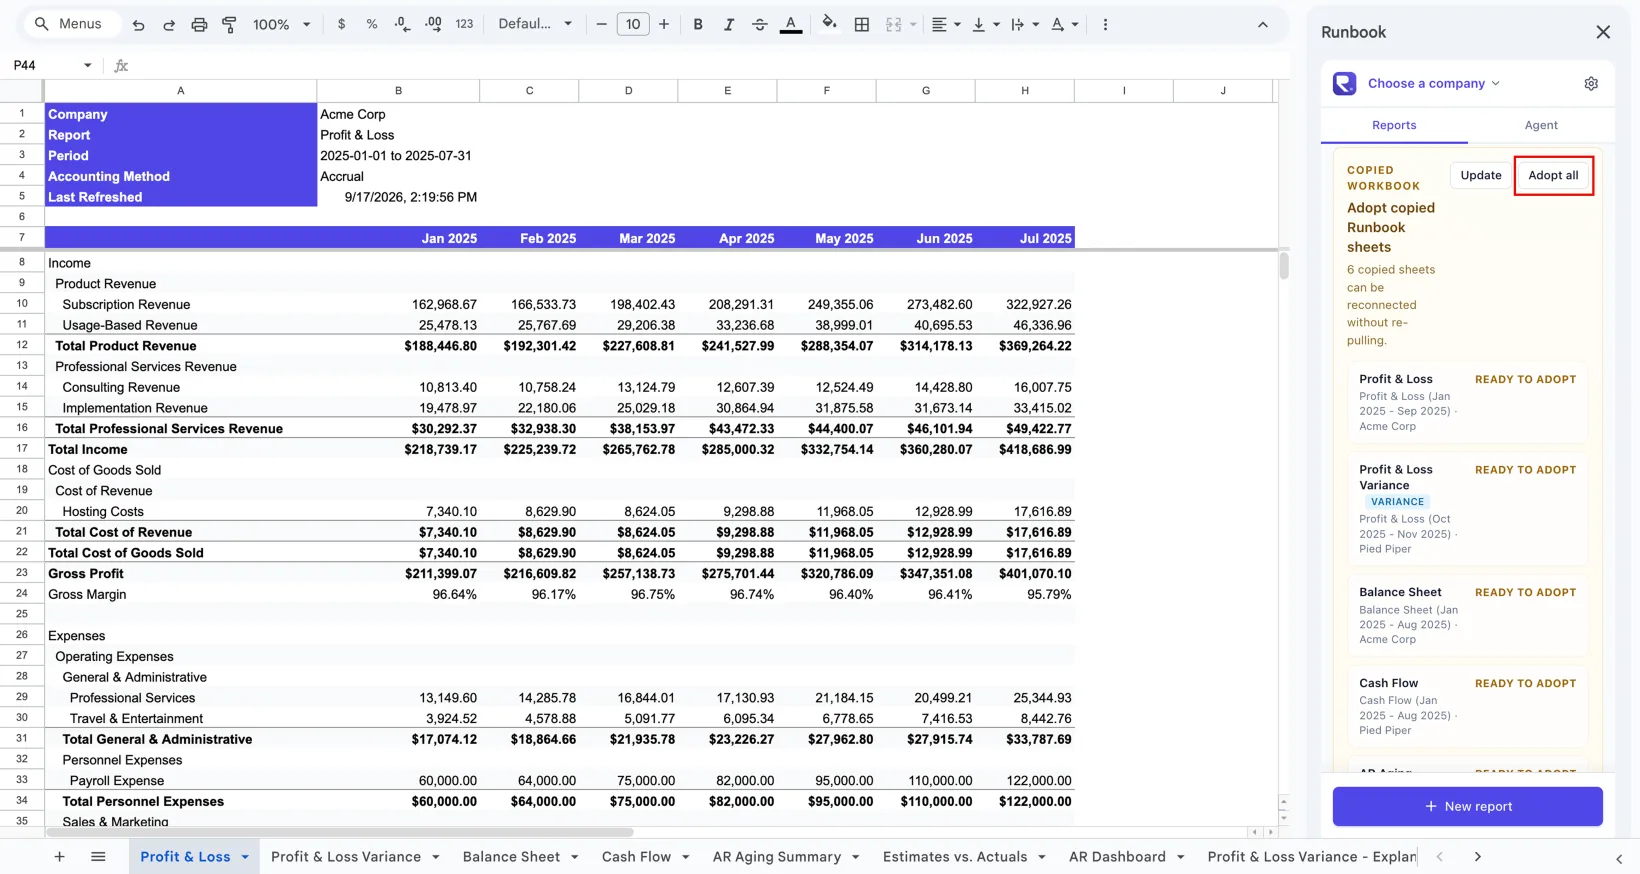
Open Runbook in the copied workbook, then adopt all Runbook reports in that workbook (this reconnects them to QuickBooks).
Click Edit reports and change the company to a different client's QuickBooks company. All reports in this workbook are now linked to the new client's QuickBooks.
Need help?
If you have questions or run into issues, we're here to help. Email sam@runbookhq.com or schedule a call here.