
How to use Runbook's AI agent
7 min read
On this page
Runbook's AI agent can do a lot. It can pull QuickBooks reports and data into Google Sheets, build new reports and analyses in your spreadsheet, and answer open-ended questions about your QuickBooks data. You can think of the agent as a team member that can read QuickBooks data and knows how to use spreadsheets, and you can ask it to do anything involving those skills.
That said, if you're looking at the chat screen wondering what to ask, it can be helpful to see some specific examples. To help you get started, we put together a list of some common use cases, along with some examples of tasks Runbook's agent can help with.
Note: the examples below are not an exhaustive list. They're meant to demonstrate Runbook's general capabilities, which you can then apply to your own workflow.
Pulling specific data and reports from QuickBooks
Runbook's agent can pull cuts of data that aren't available in QuickBooks' standard reporting features. This is helpful when you're building a custom report or analysis that requires a specific slice of data. Rather than pulling a full report or transaction list and manually cleaning it in a spreadsheet, you can just ask Runbook to pull the data you want by describing it in plain English.
Here are a couple examples.
Example #1: Expense reporting
Say you want to create a report to understand trends in your expenses over time. You could start with a P&L to see expenses over time at a high level, but you'll probably have several questions about the underlying data:
- Which vendors have been costing more/less over time?
- Which vendors did I spend the most on in the past 3 months?
- How many bills were over $5K last month, and what were they?
- Were there any abnormally large bills in the past few months (over $10K)?
Rather than slicing and dicing the data yourself, you can just ask Runbook to do it for you.
Example prompt: "Show me expenses by vendor for the past 6 months and highlight the top 5 vendors with the largest cost increase."
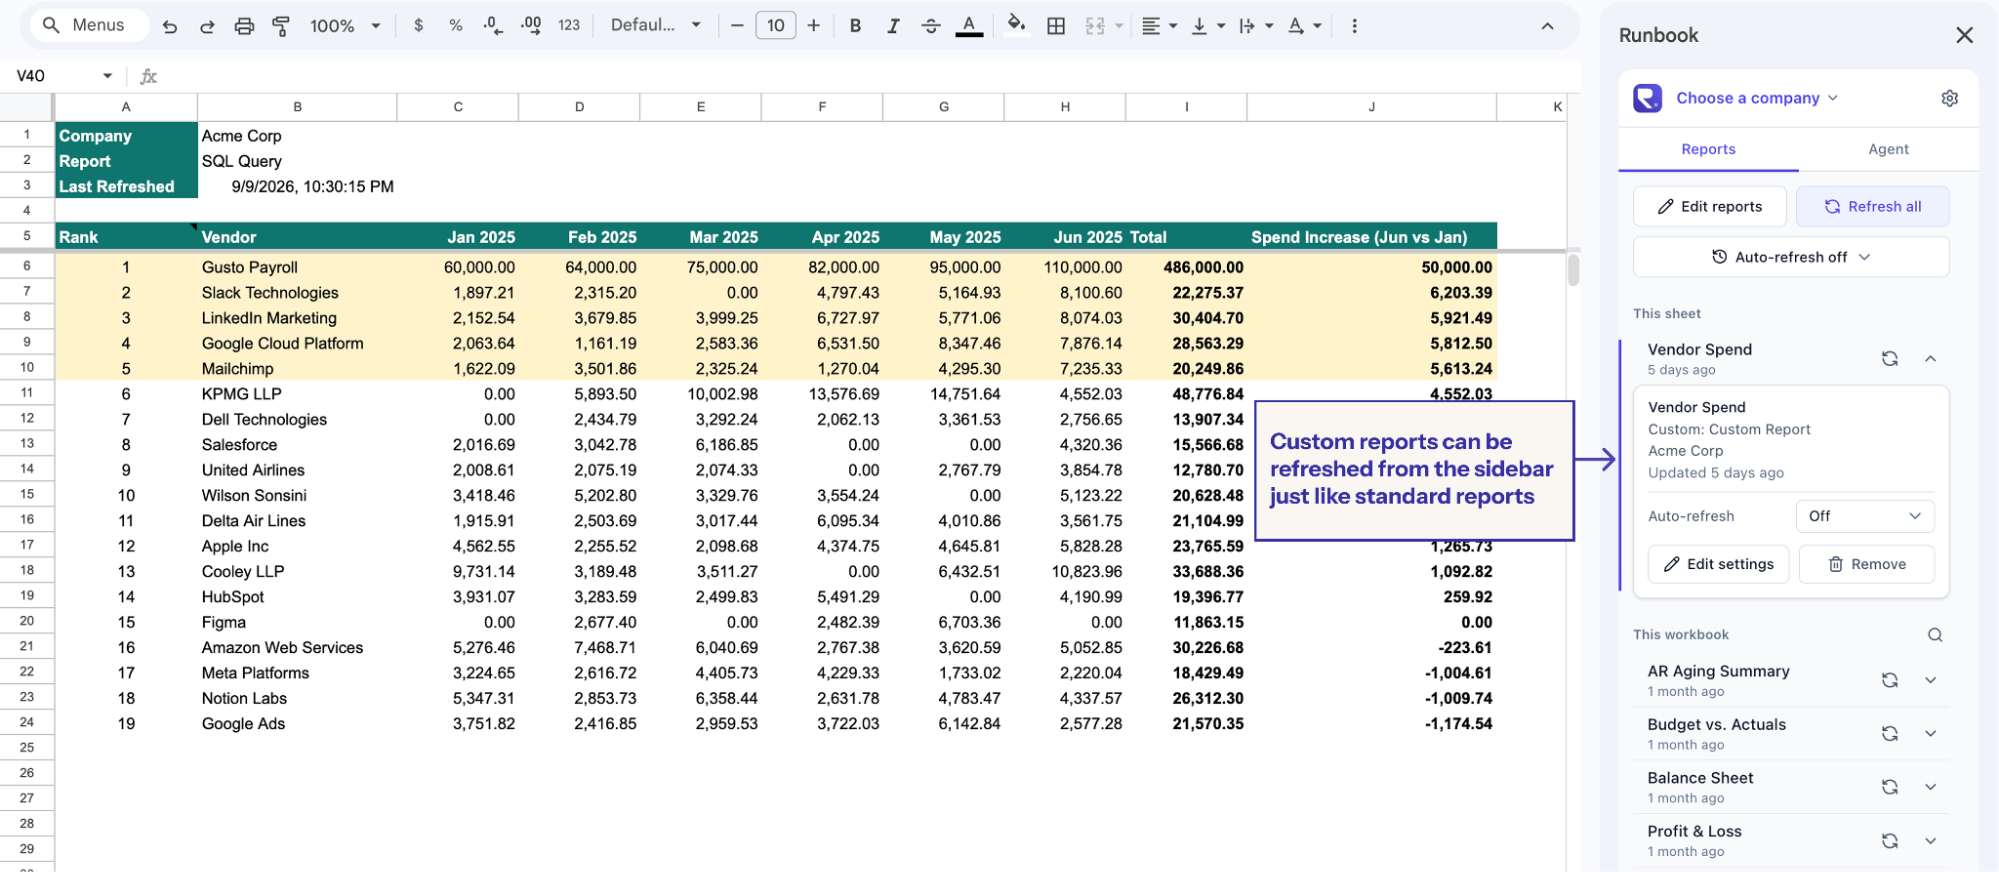
This functions just like any other Runbook report. You can refresh it with new data and edit the report configuration.
Example #2: Work-in-progress (WIP) reporting
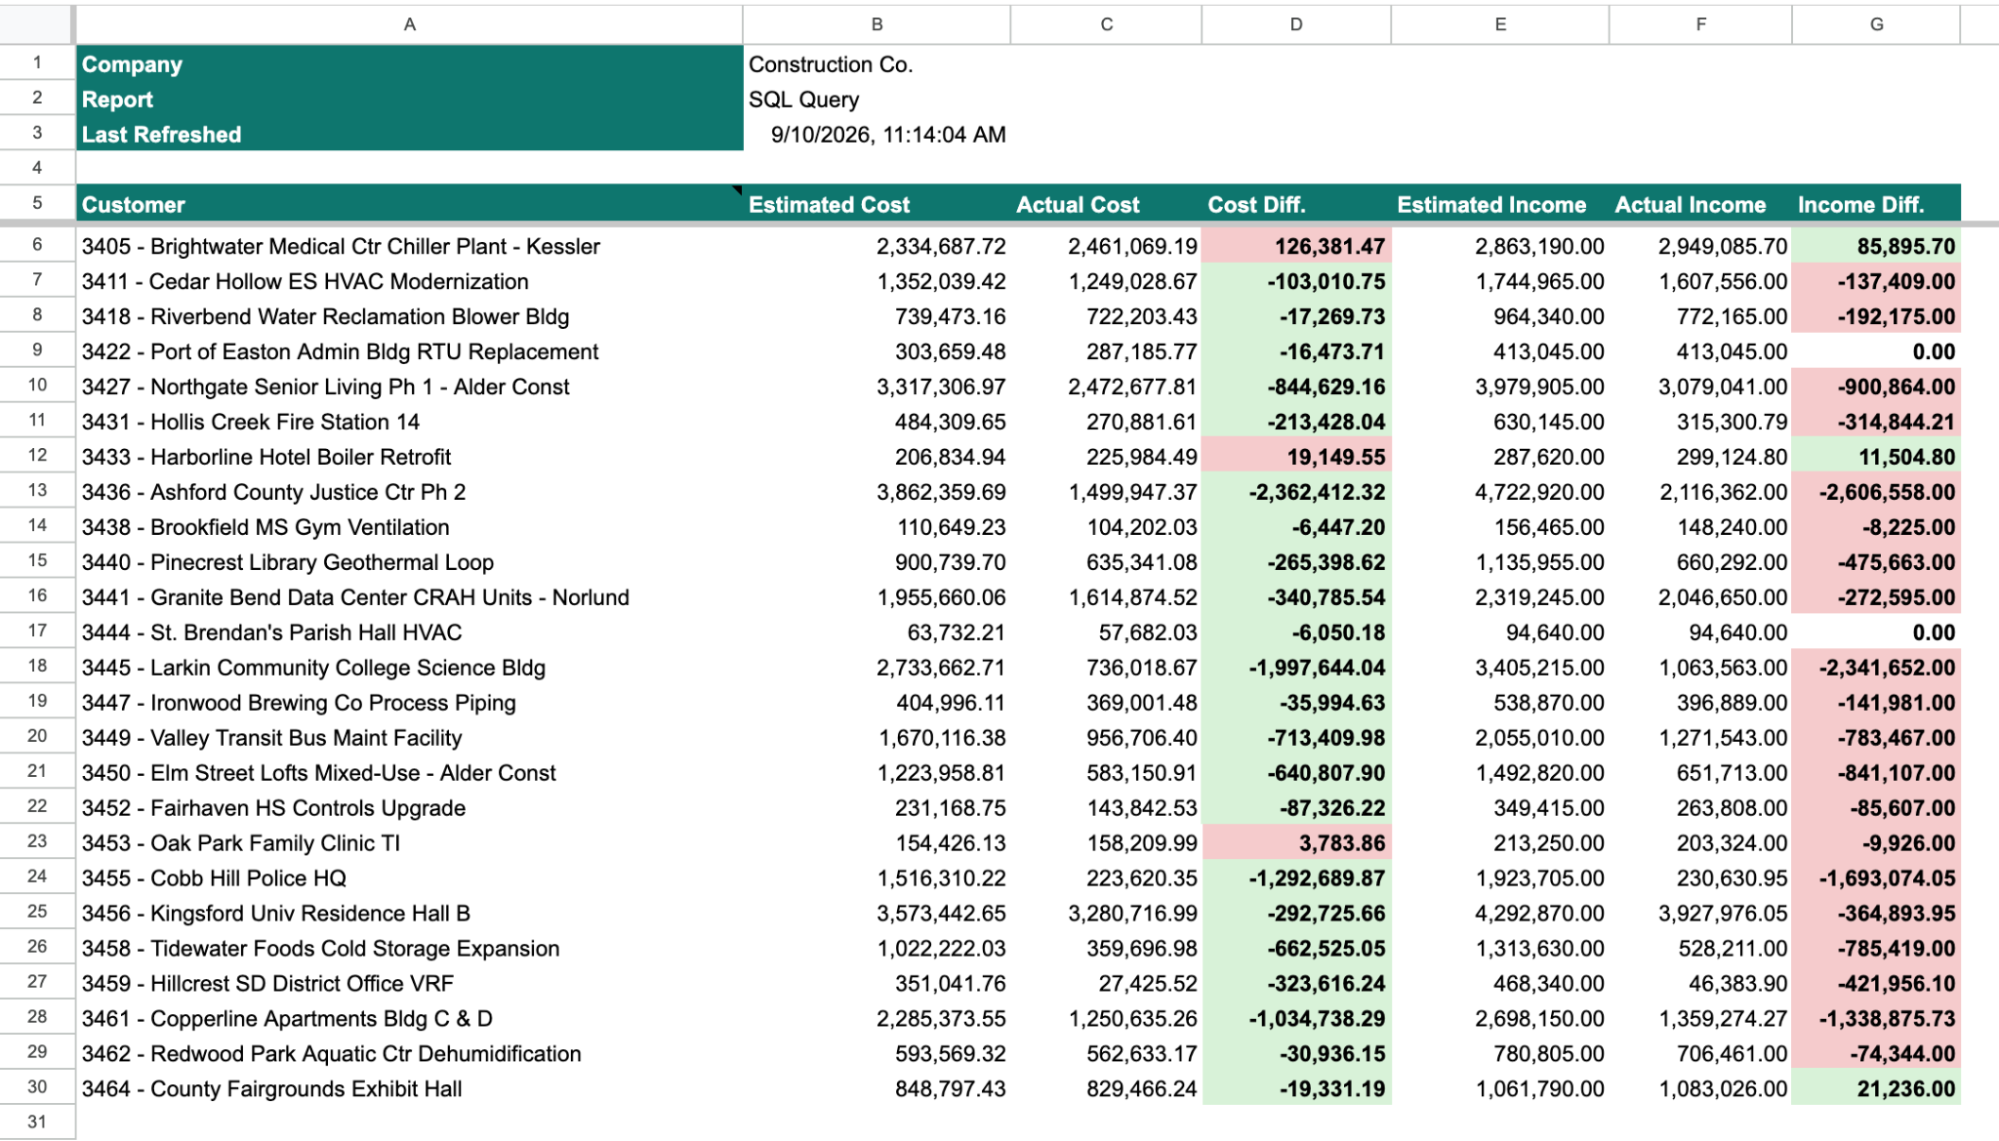
If you track estimated vs. actual costs and income by project in QuickBooks, you might want to see a single report with estimated vs. actual amounts across all projects. Unfortunately, there isn't a way to build that report in QuickBooks. You can only see estimated vs. actual amounts by each project individually, so you'd need to piece them together into a consolidated report manually.
Instead, you can ask Runbook to pull the consolidated data into Google Sheets.
Example prompt: "Show me estimated and actual costs and income across all projects."
Building new spreadsheet reports
The previous examples showed how to pull specific cuts of data from QuickBooks to Google Sheets. Runbook can also work inside your spreadsheet to build new reports with the data that it pulls from QuickBooks (writing formulas, formatting cells, etc.).
Example #1: Building an AR dashboard
Let's say you want to build an AR dashboard to keep track of all overdue invoices. The typical process would be:
- Use Runbook to pull an AR Summary and AR Detail report for a specific time period
- Manually build a dashboard in a separate Google Sheets tab using formulas to reference the live data
Runbook's agent can do this entire process for you.
Example prompt: "Pull an AR Summary and Detail report as of today, and build an AR dashboard tracking all overdue invoices by customer."
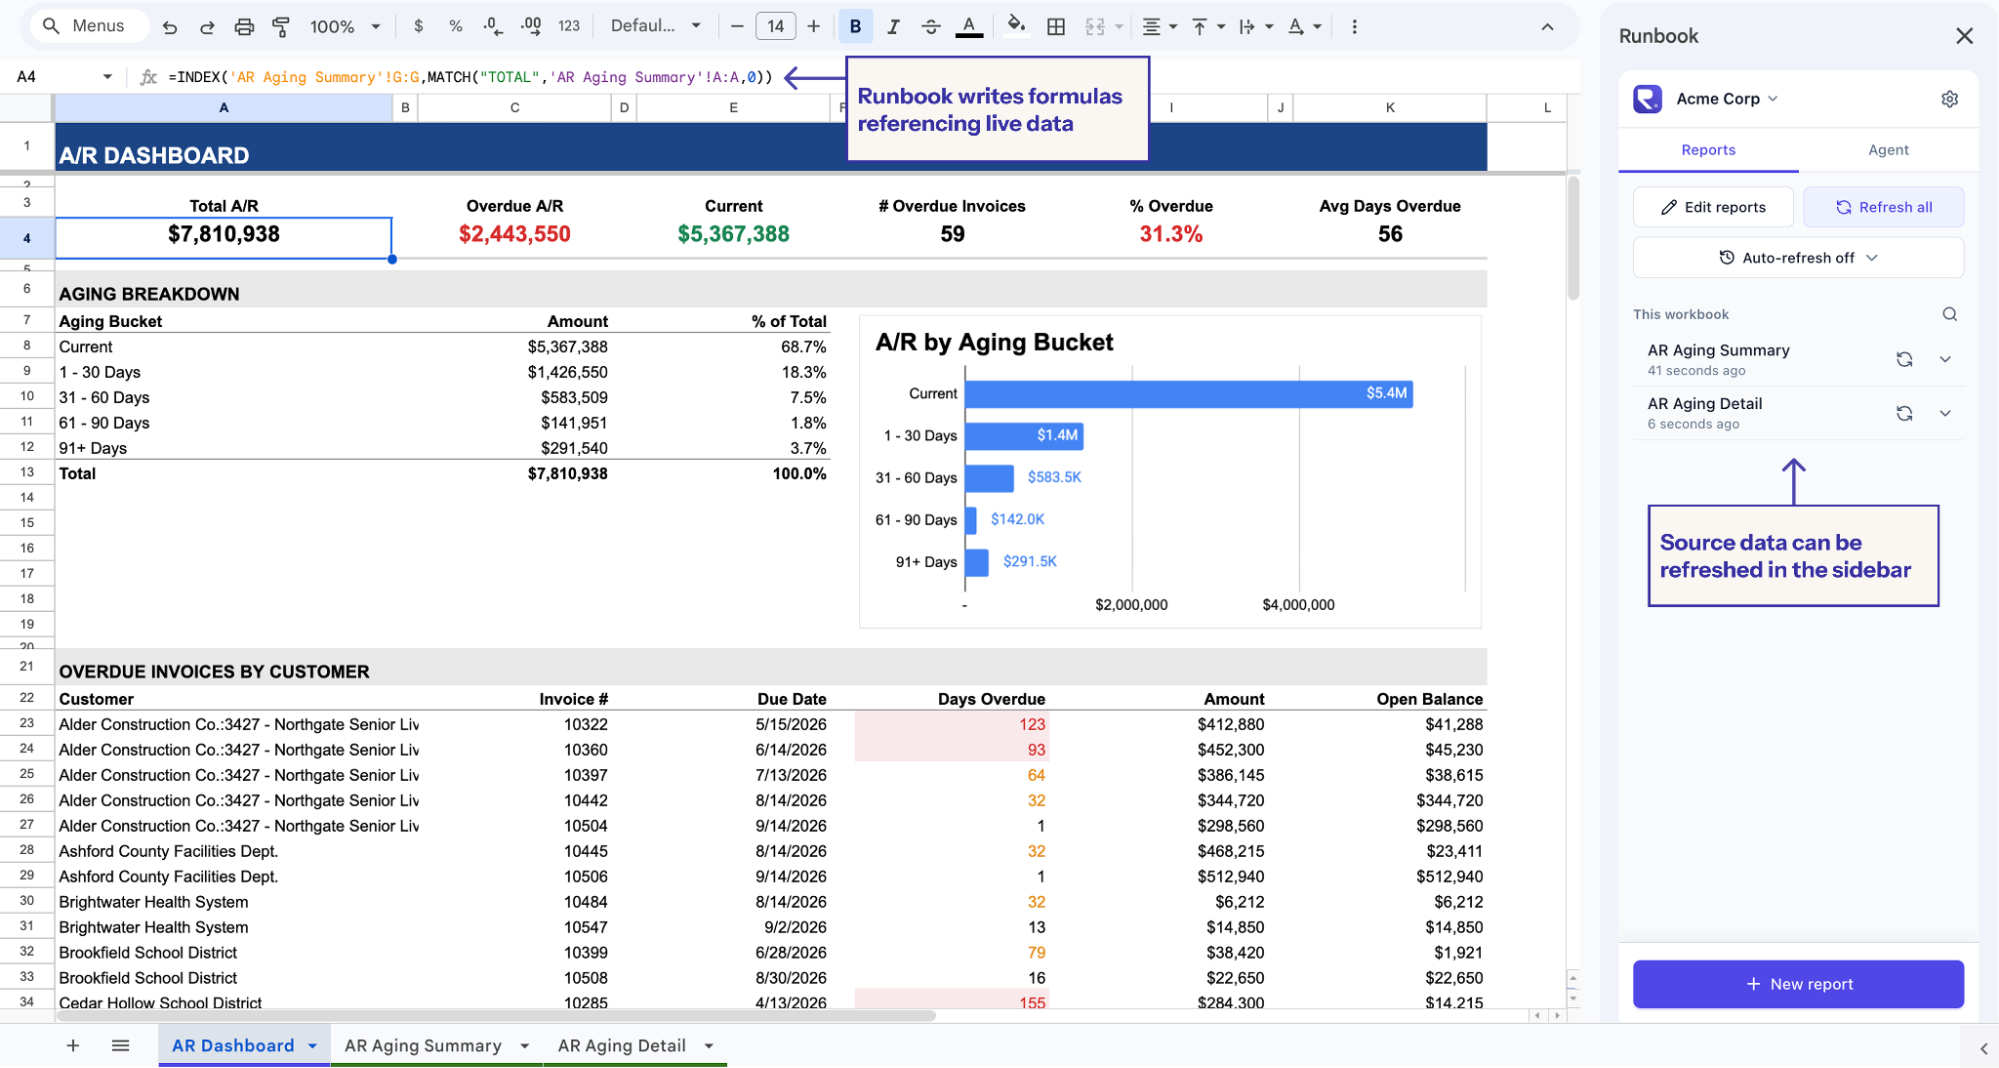
Runbook pulls the relevant reports from QuickBooks and builds the dashboard using formulas to reference the live data. That way, when you refresh the source reports, the dashboard refreshes too.
Example #2: Building a forward-looking budget
Runbook can also help with budgeting and forecasting by building projections from historical trends. For example, say you want to build a P&L budget for the next 12 months based on historical data from the last 3 years.
Example prompt: "Build a P&L budget for 2027 based on the last 3 years of data. Include a section of editable assumptions at the top."
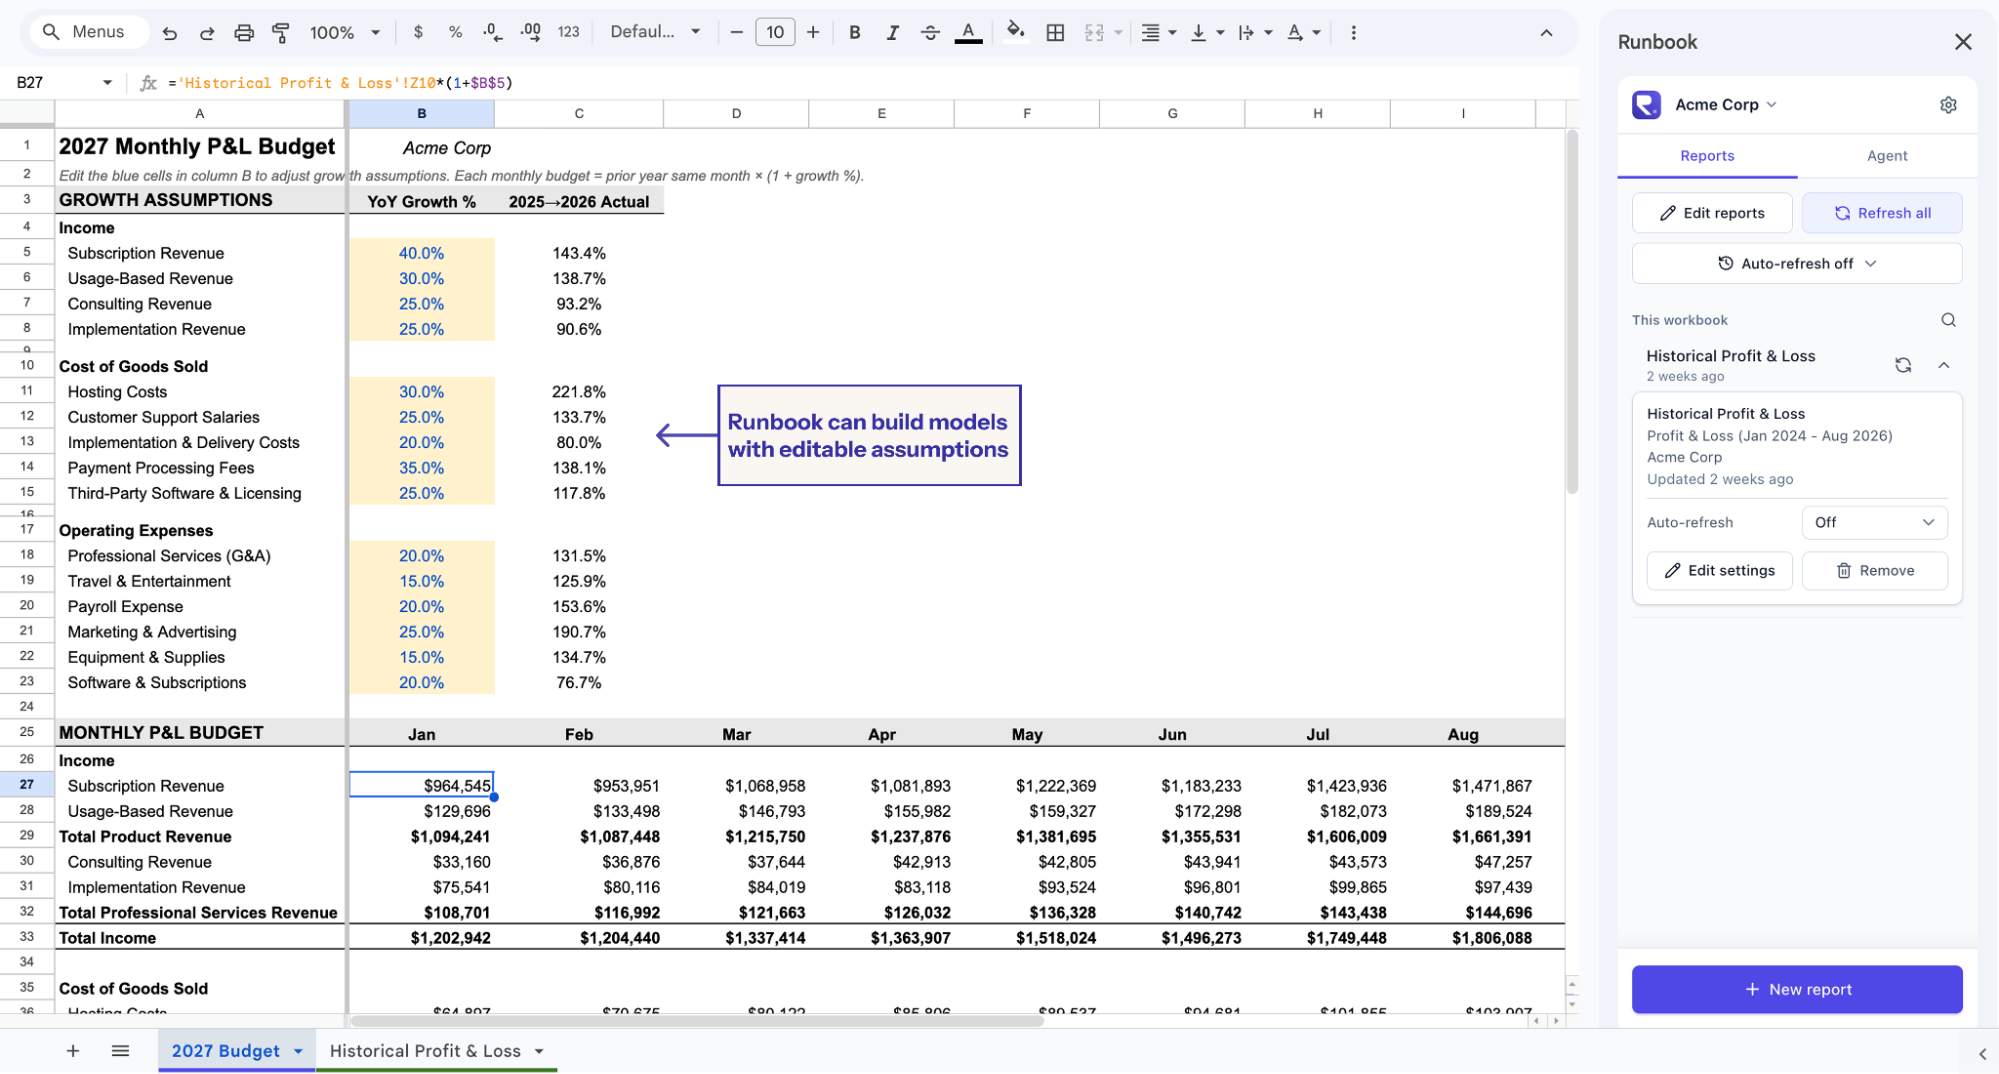
Runbook pulls the prior 3 years of P&L data and builds a budget with formula-driven projections. It also includes assumptions that you can review and edit.
Ad-hoc analysis
Lastly, Runbook's agent can help with ad-hoc analysis. It can dig through your QuickBooks data to answer questions, explain variances, or spot anomalies that require human review.
Example #1: Variance analysis
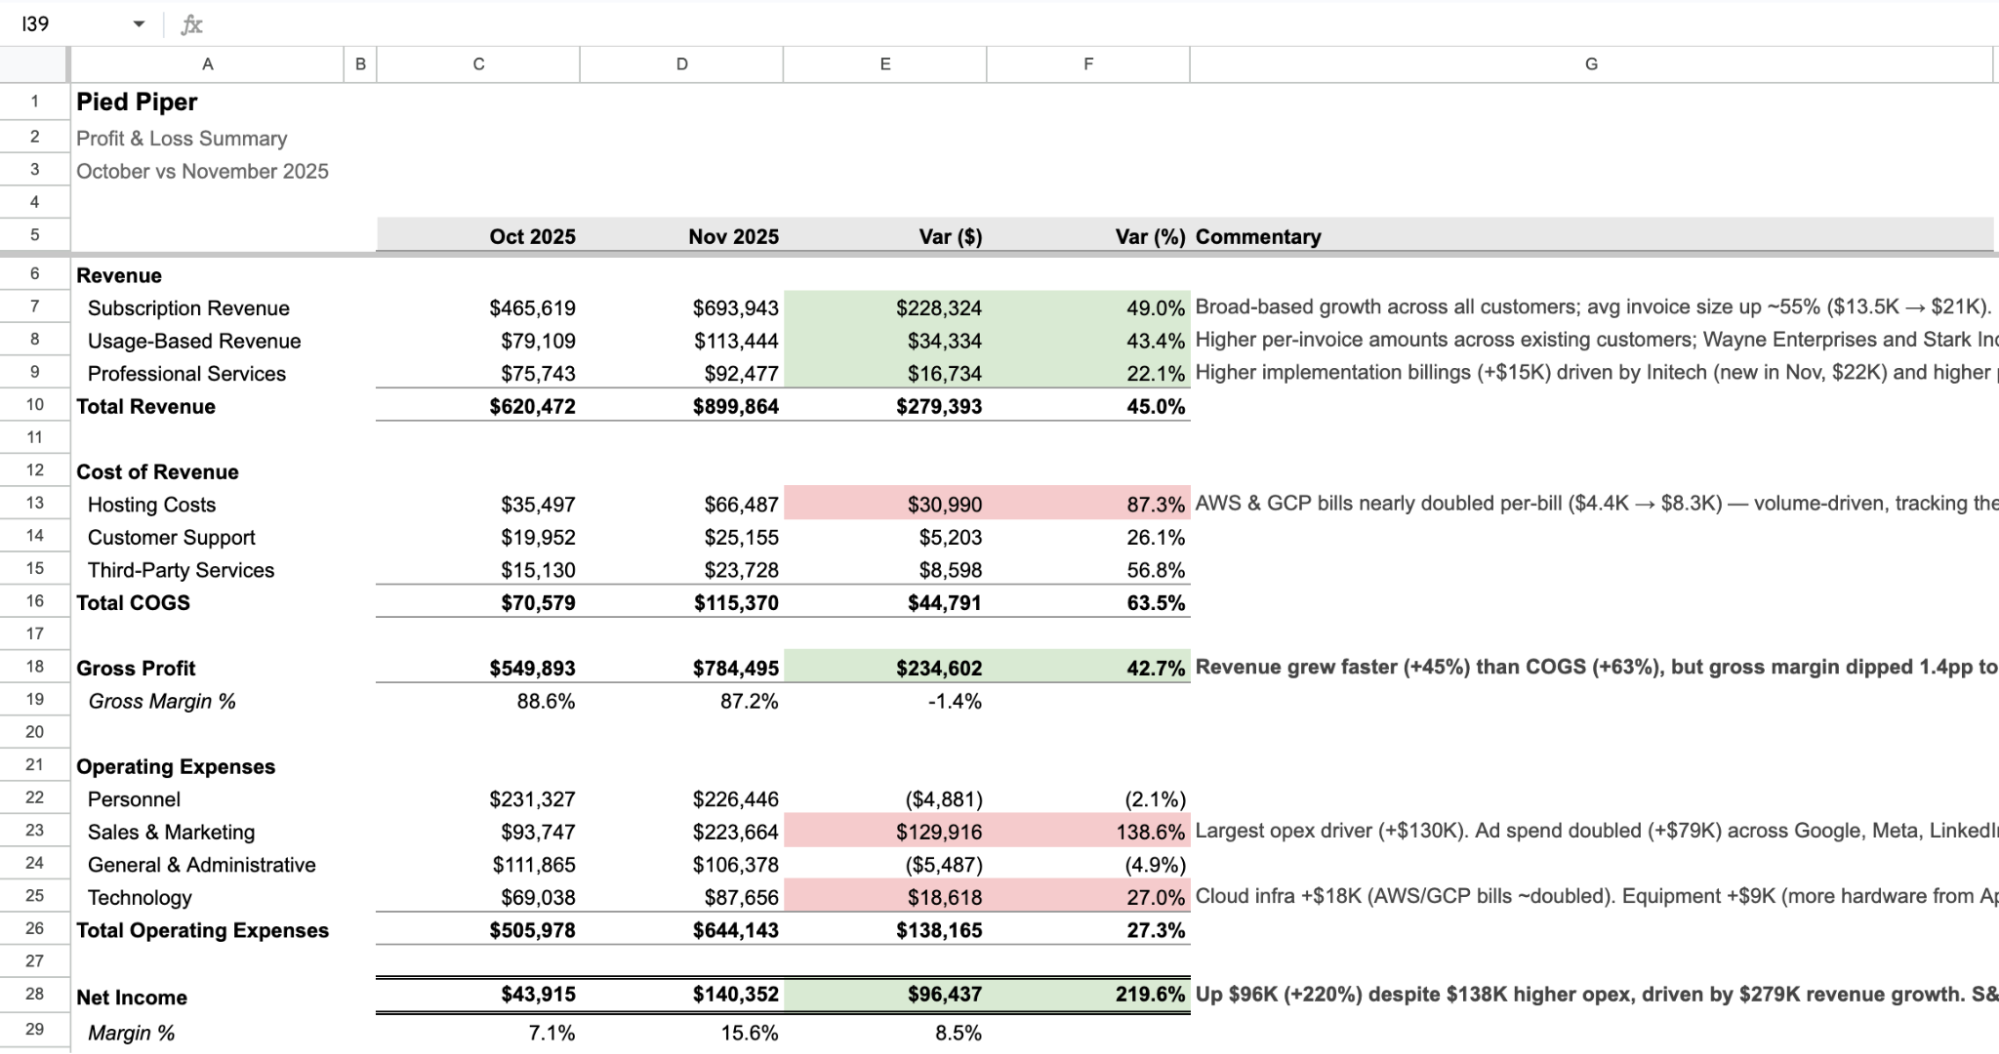
Say you're looking at a P&L with a lot of month-over-month noise: there are 20+ line items and some are showing large month-over-month fluctuations. You might want to see a summarized version of the P&L that highlights important changes (and explains what's causing them), giving you a clear picture of what's happening in the business.
Runbook's agent is great at this kind of synthesis and explanation.
Example prompt: "Create a summarized P&L comparing Oct and Nov 2025, with explanations for all variances >$10K and >10%."
Example #2: Monthly general ledger review
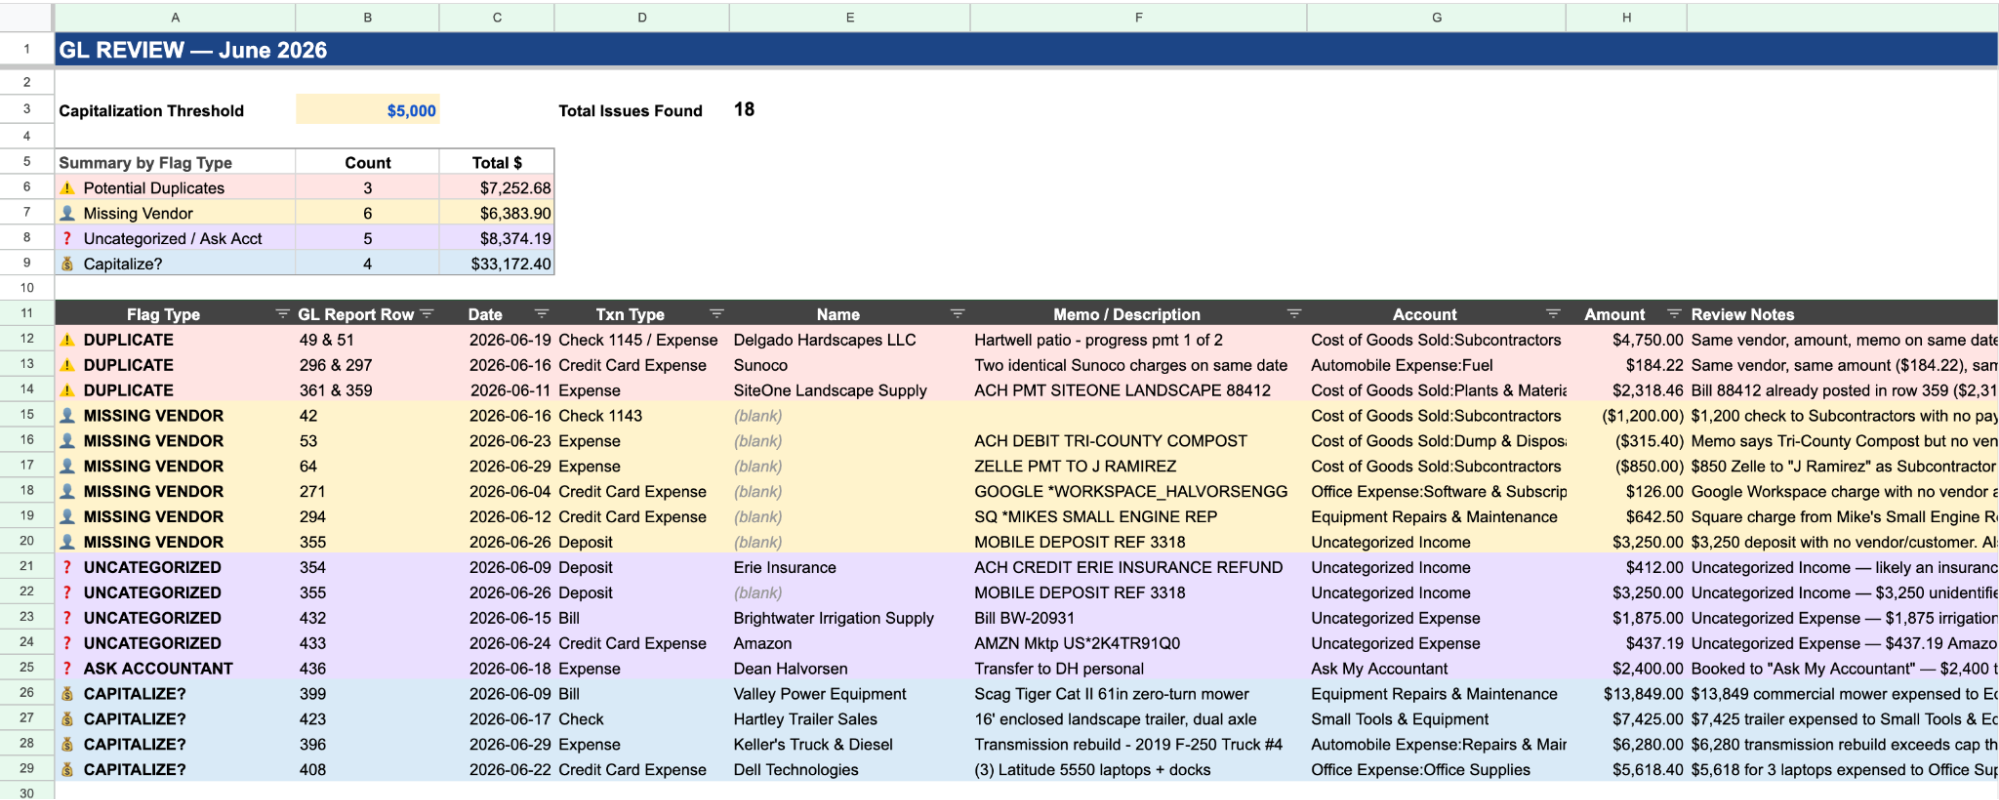
Most finance and accounting teams review the GL each month to investigate anomalies and check for potential errors: duplicate entries, misclassifications, missing names, failure to capitalize a cost, etc. This process is painstaking and error-prone, often relying on manual human review.
Runbook can sift through all of your GL data every month and flag anomalies in a fraction of the time.
Example prompt: "Build a GL review for June 2026. Flag any duplicate entries, expenses with missing vendor names, uncategorized expense/income, or uncapitalized costs above the capitalization threshold ($5K)."
Tips for using Runbook's agent in your own workflow
Now that you have a sense of what Runbook's agent can do, you can start experimenting with use cases that are relevant to your individual workflow. Here are some tips and best practices as you get started.
Iterate
You should think of using the agent as an iterative, collaborative process: if the agent does something different from what you want, or if you decide on a different approach after you see the output, you can follow up with additional instructions and clarification. You can even ask the agent to propose a plan for a specific task and provide feedback before it gets started.
Save your prompts in Google Sheets
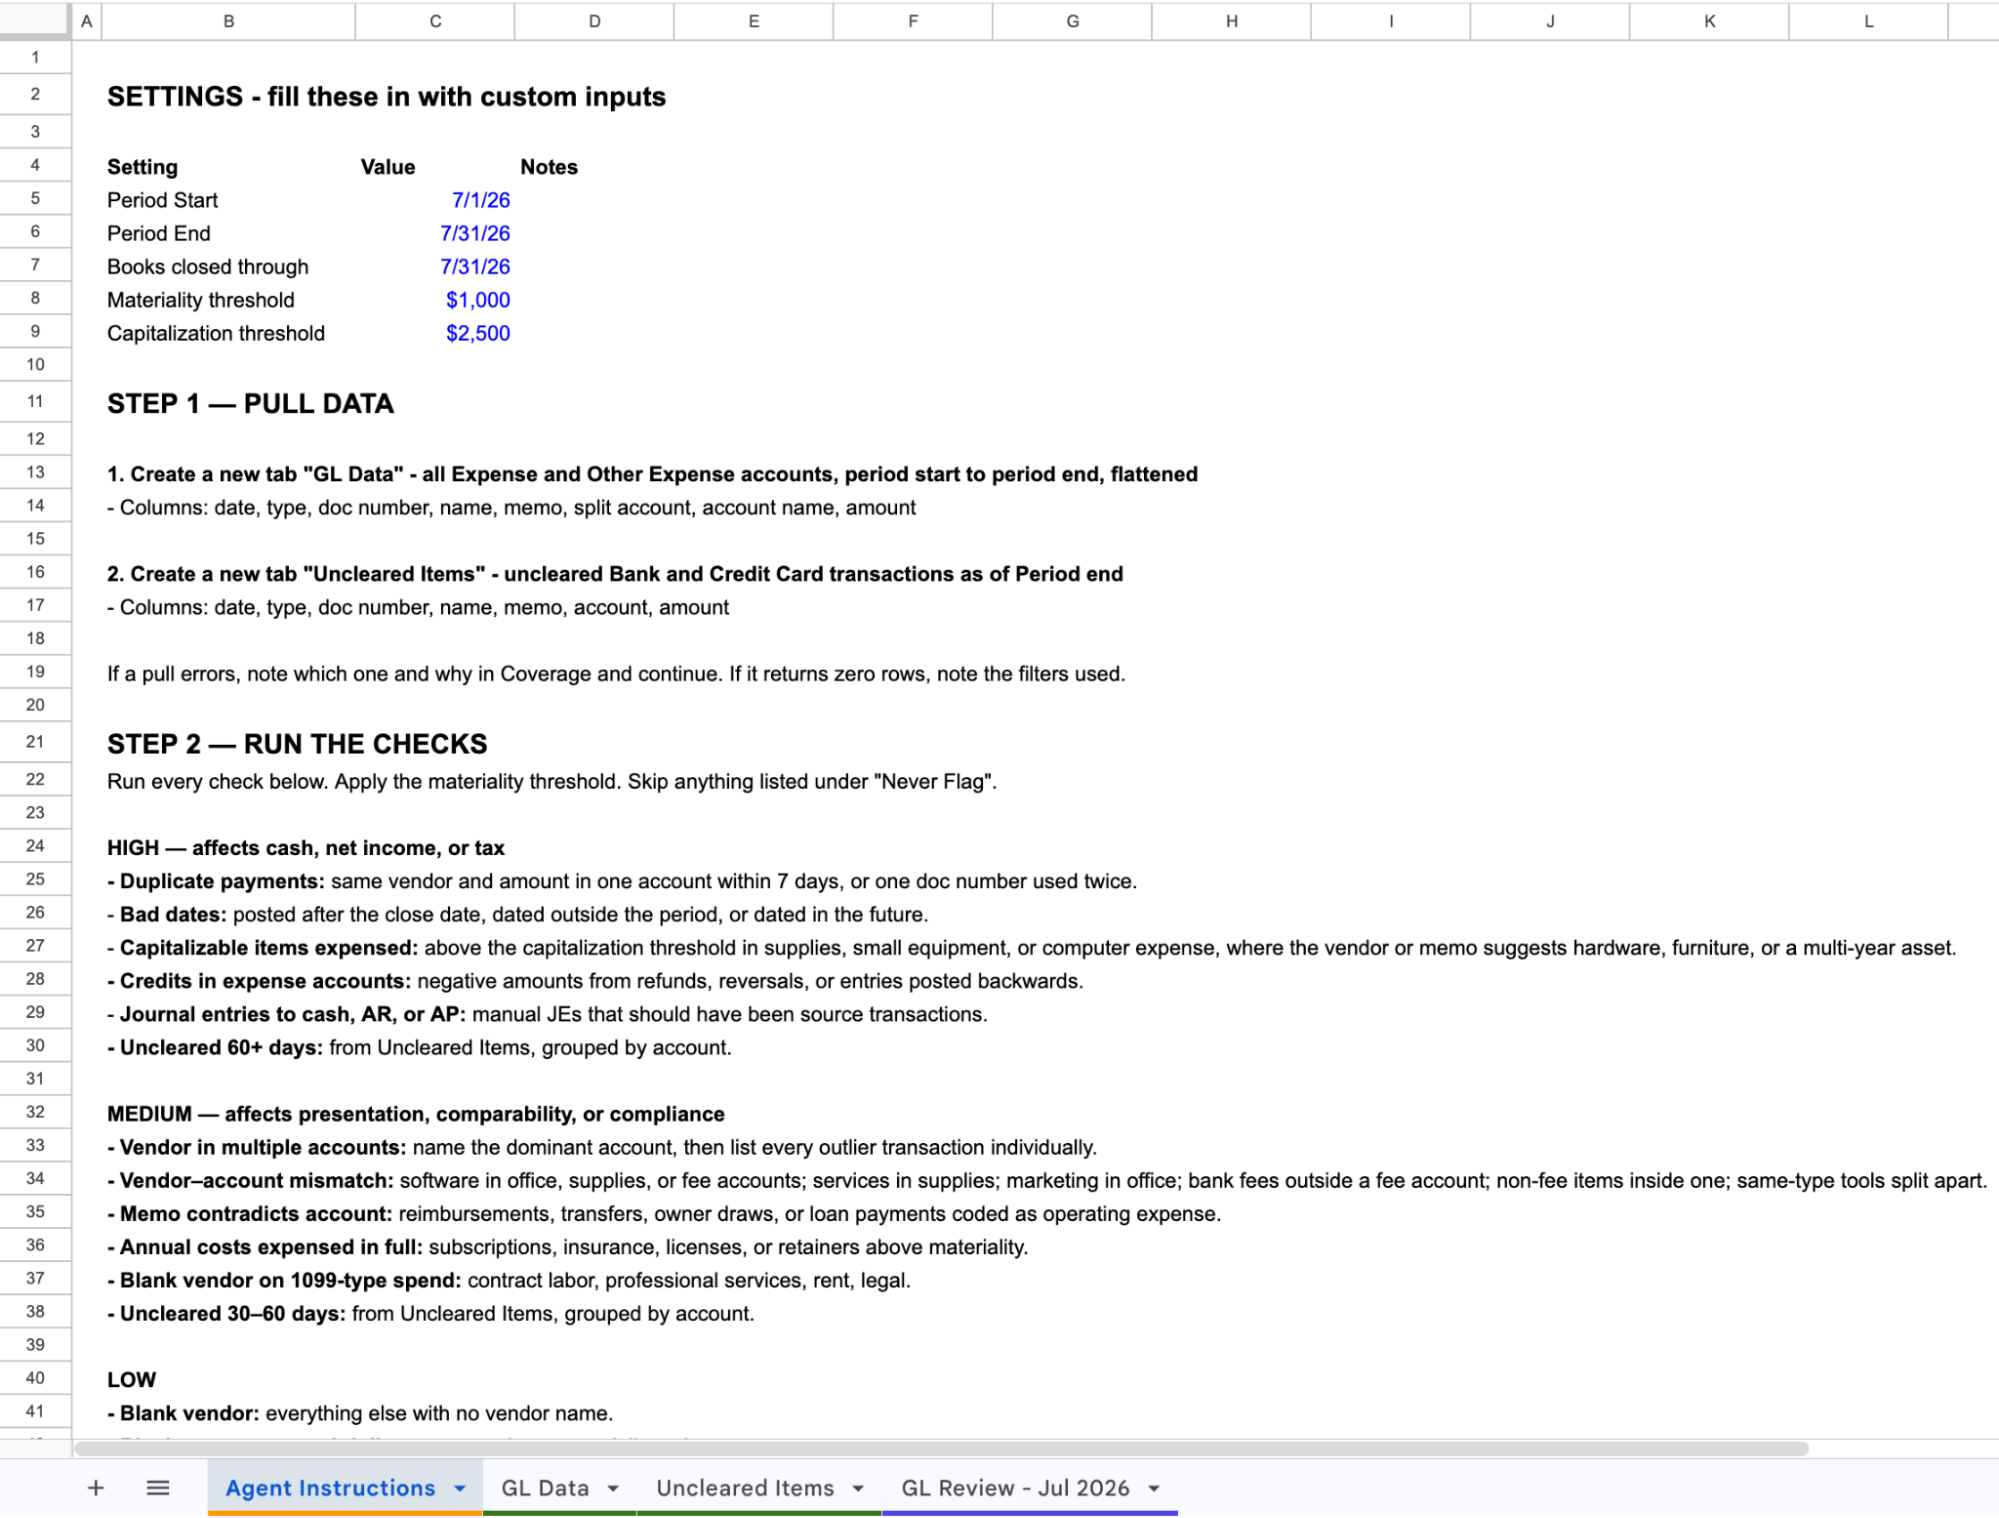
If you're using the agent for a recurring task (like monthly variance analysis), it's often a good idea to create a reusable prompt. You can do this by writing the prompt in a new Google Sheets tab. Name the tab something like "Agent Instructions," then when you want the agent to repeat the task you can just say "execute the instructions in the Agent Instructions tab" rather than re-writing the prompt.
This also makes it easier to write highly detailed instructions for the agent, which you can continue to refine over time. For example, detailed instructions for a monthly GL review might look like this:
Give the agent a template
If you know the exact format of the output you want, you can give the agent a template to fill out or an existing report to copy.
For example, say you built a 2026 budget with a format that you like, and now you want to create a new budget for 2027. Copy the 2026 budget into a new Google Sheet, then ask Runbook to build a 2027 budget using that exact structure.
Questions?
If you have questions or get stuck, we're happy to help. Email sam@runbookhq.com or schedule a call.